
Introduction
The Institute for Apprenticeships and Technical Education (IfATE) runs an annual survey of our stakeholders, to capture feedback and help us improve our services. This report contains the results from the December 2021 edition of the survey, and follows on from the 2020 Stakeholder Survey.
363 people responded to the 2021 - 2022 Survey, a notable increase on last year’s total of 243. We captured feedback from a broad range of our stakeholders, including different types and sizes of organisation, and representing all regions of England.
Methodology and analysis
We shared the survey with our stakeholders through email distribution lists, social media, and IfATE’s website. The people who responded might not represent all our types of stakeholder and their views. They also might be different people than those who answered last year. The results still give us a useful insight into the views of those 363 people who responded.
We asked for some information in the survey to allow us to break down our analysis by groups1. We looked at employers, training providers and End Point Assessment Organisations. We also looked at two sub-groups of employers: SMEs (Small and Medium Sized enterprises: organisations with 250 or fewer employees), as well as employers not in London.
Finally, we broke down the analysis by route group:
- Engineering, Construction and Transport covers the Engineering and Manufacturing; Construction; and Transport and Logistics routes.
- Business Services covers the Business and Administration; Digital; Legal, Finance and Accounting; Sales, Marketing and Procurement; and Creative and Design routes.
- People Services covers the Agriculture, Environmental and Animal Care; Health and Science; Care; Catering and Hospitality; Education and Childcare; Hair and Beauty; and Protective Services routes.
Differences between these groups were not found to be statistically significant (Fisher’s test was completed for all relationships). We have included some of the differences in the report because they are useful to consider, even if not significant.
Percentages used in this document are all rounded to the nearest whole number. This means percentages may not add up to exactly to 100. Where we group options together, the total might not match up exactly to the individual rounded percentages added together.
In some cases, where response numbers are very low, categories have been grouped to protect participant anonymity.
The full data for all questions can be viewed in the accompanying data tables.
Overall impact of IfATE
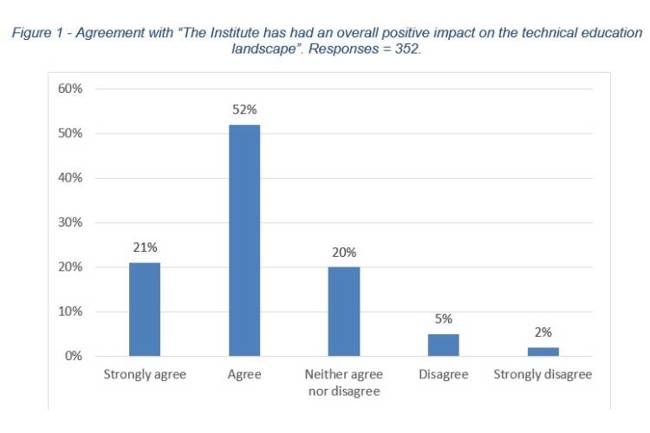
Overall, respondents had a positive view of the impact of IfATE on the technical education landscape. 73% of respondents agreed that IfATE has had a positive impact, and only 7% disagreed.
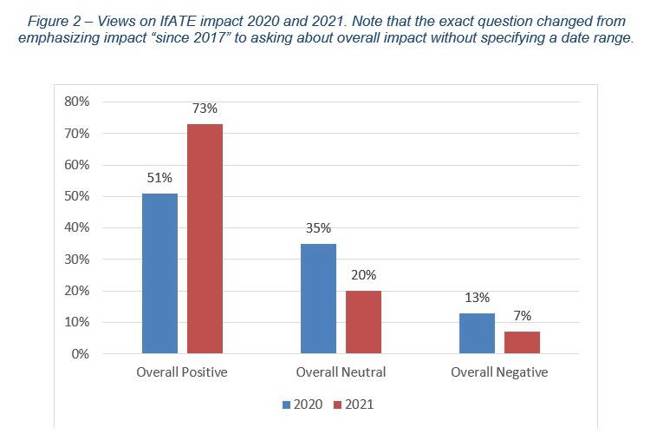
In previous years the survey asked whether respondents thought IfATE had had a positive impact since 2017 (this question is slightly different – although still comparable.). The results show a positive trend in views on IfATE’s impact – positive responses have jumped from 51% to 73%.
Customer satisfaction
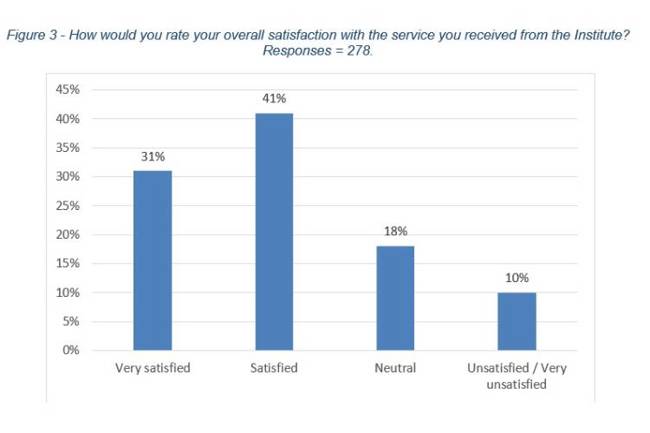
The majority of stakeholders were satisfied with the service they received from IfATE - 72% said they were satisfied while only 10% were unsatisfied.
There were generally few differences in satisfaction levels between the groups we looked at. The slight exception to this was employers aligned with the Business Services route group – of whom 60% reported satisfaction (compared to 72% overall) and 22% reported dissatisfaction (compared to 10% overall).
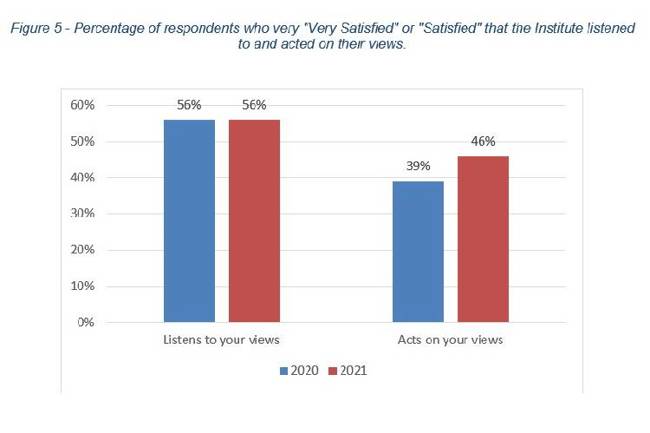
Listening and acting
The majority of respondents felt that IfATE listens to their views, with 56% responding favourably on this measure (compared to 17% dissatisfied). The picture was more mixed for acting on stakeholder views: 46% were satisfied, with 34% responding neutrally and 20% dissatisfied.
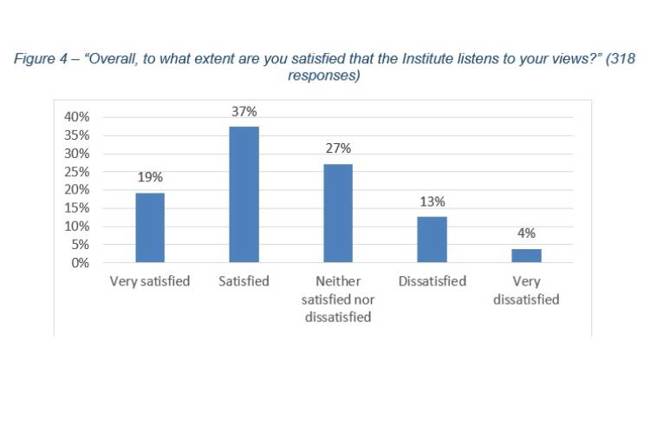
Figure 5 shows the favourable responses to these questions compared between 2020 and 2021. IfATE has made an improvement in acting on stakeholder views, with satisfied responses to this question increasing by 7 percentage points.
Apprenticeships
The majority of respondents thought IfATE performed well on apprenticeships. Overall, 74% of respondents thought IfATE performed well on supporting the development of apprenticeships, 60% thought we performed well on reviewing and updating apprenticeships, and 58% thought we performed well on ensuring EQA works for employers.
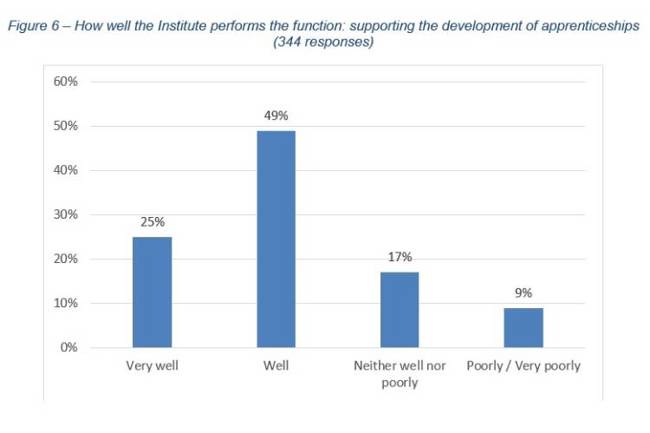
Views on apprenticeships were largely consistent across the groups we looked at, with two exceptions.
End point assessment organisations were less likely to think that IfATE did a good job of reviewing and updating apprenticeships (45%).
SMEs were less likely to think that the Insitute did a good job of ensuring EQA works well for employers, with a 43% favourable response rate, 15 percentage points lower than the overall rate of 58%.
T levels
A majority of respondents thought IfATE performed well on T levels. 66% of respondents thought that IfATE performed well on supporting the development of T levels, and 61% of respondents thought we performed well on managing the procurement process.
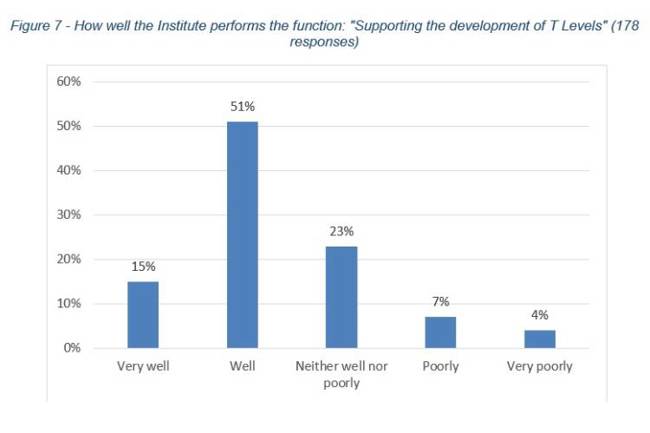
Results were generally quite consistent across the groups we looked at. There was, however, some variation among the groups we looked at for the “supporting development” measure. Employers in the Business Services and People Services route groups were more likely than others to say IfATE performed well (both at 58%), but Employers as a whole, and SME employers specifically, were less likely to say we did well or very well on this measure (50% for both groups).
EPAOs were more positive than the overall rate for “supporting development” (78% - 13 percentage points higher than the overall rate), but less positive on “managing a fair and transparent process” (50% - 11 percentage points lower than the overall rate).
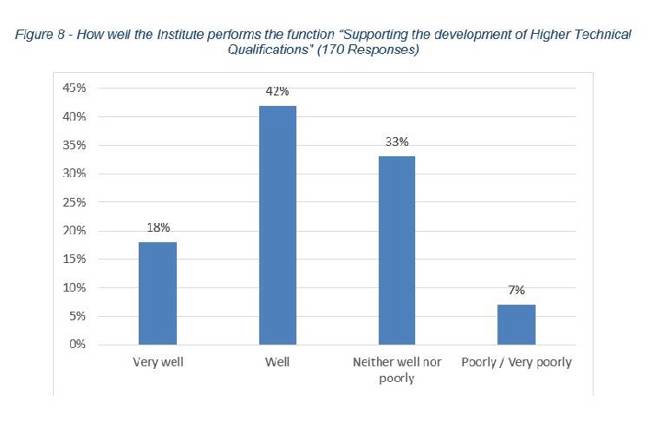
Higher technical qualifications (HTQs)
The majority of respondents felt that IfATE did well on HTQs. 60% of respondents felt that IfATE performed well at supporting the development of HTQs and 61% of respondents though we performed well at managing the approval process.
Working with employers and occupational maps
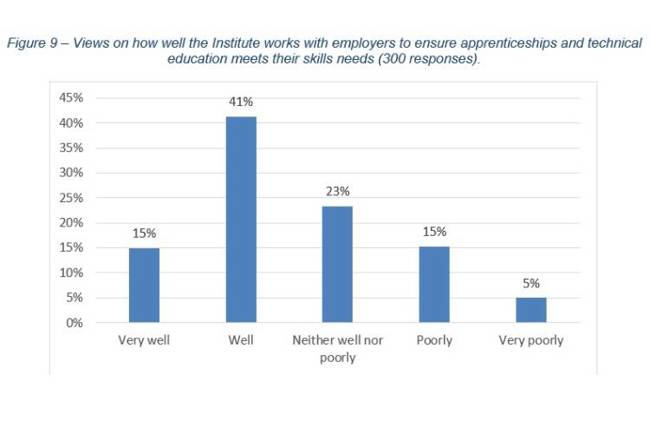
A majority of respondents felt that IfATE works well with employers to meet their skills needs. 56% of respondents thought we did this well, while 20% of respondents thought we performed poorly.
Similarly, a majority of respondents agreed that IfATE’s technical education products meet current training needs, with 59% agreeing that technical education products meet current needs and 15% disagreeing.
A majority of responses were positive about IfATE’s occupational maps. 64% of respondents agreed that they were a useful guide, while only 12% disagreed
Equity, diversity and inclusion (EDI) and green skills.
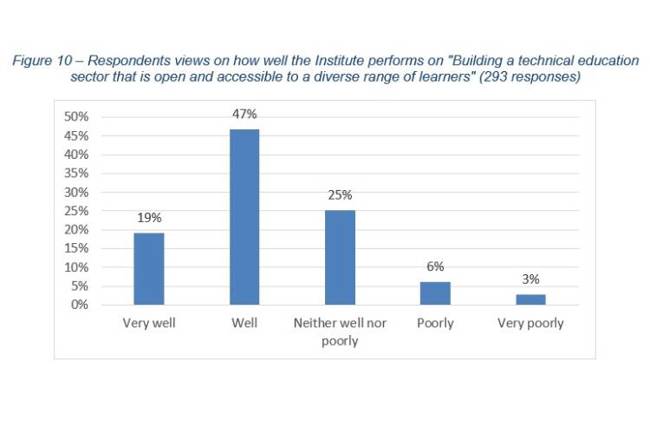
66% of respondents felt IfATE did well at creating an accessible technical education sector, and 64% felt that IfATE did well at building a sector where a diverse range of people could progress and succeed.
Results were similar across the groups we looked at, with the only slight outlier being SMEs, who were less likely to say that IfATE did well at creating a sector accessible to all (54% compared to 66% overall).
45% thought that IfATE had performed well on supporting green skills. SMEs were less positive here than other stakeholders, with 33% saying IfATE had performed poorly (compared to 17% overall).
We also asked how IfATE should be using its influence going forward in this area. Responses were spread fairly evenly across updating existing apprenticeships (216), creating innovative products (193), and facilitating dialogue between stakeholders (192) and fore-sighting and horizon scanning (143).
Supporting tables
Get in touch
Please direct any questions and queries to the policy analysis team at DataScience.IFA@education.gov.uk